Our dataset, the Walkability Index, includes information about every Census 2019 block group in the U.S. based on its relative walkability. Walkability is defined as a place easy to walk around. To determine how walkable a block is, they took into consideration intersection density, proximity to transit stops, and diversity of land uses. Each block in the U.S.A. was given a ranking: “most walkable”, “above average walkable”, “below average walkable”, and “least walkable”. This information is very important because a more walkable community means that people are more likely to be more active to stay healthy, which in turn decreases the amount of pollution from the usage of vehicles. It can help conserve natural resources and reduce infrastructure costs. And on a social level, walkable communities encourage human interaction, which can improve overall mental health. This means that blocks with higher walkability rankings most likely have the said benefits, while blocks with lower walkability rankings most likely do not have as many of the said benefits. It also may reveal the amount of investment into infrastructure, as there needs to be funding for sidewalks for civilians to walk around the block.

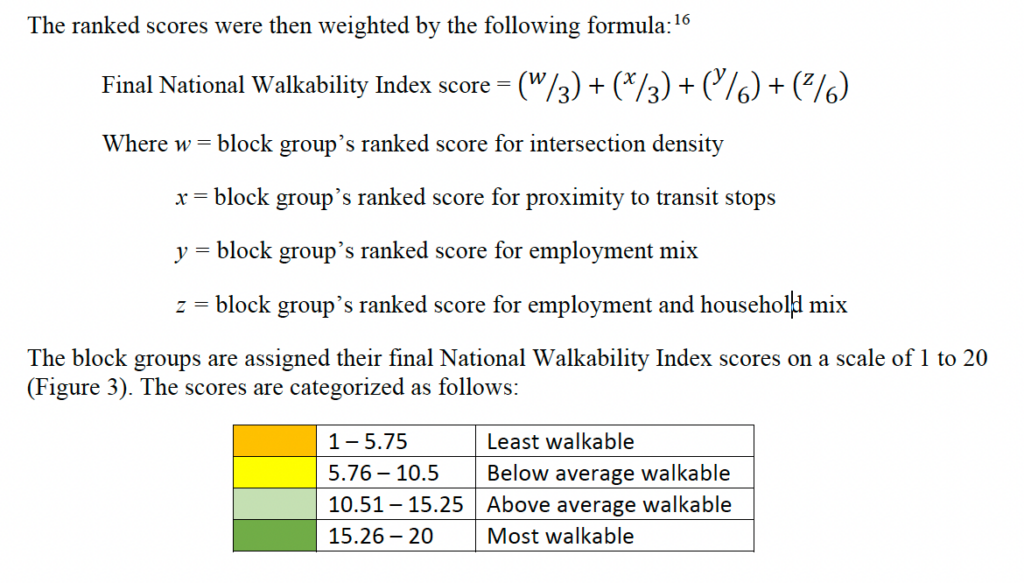
As for how the data was generated, walkability indices were calculated at the block group level, which is between the size of a census tract and a census block. A block group is a unit of census geography whose size is inversely proportional to its population density. The data was generated by grouping variables into the Smart Location Database. This database includes intersection density, proximity to transit stops, and diversity of land uses in relation to employment and housing, where each variable had its own ranked score from 1 to 20. A score of 1 to 5.75 is classified as “least walkable,” 5.76 to 10.5 is “below average walkable,” 10.51 to 15.25 is “above average walkable,” and 15.26 to 20 is considered “most walkable.” Finally, the walkability index score was calculated using the formula listed below, which proportionally weighted the variables’ influence on walkability.
While the EPA’s Walkability Index is a very robust model for determining whether an area is “walkable”, it has some limitations due to its simplicity. The index score is calculated using a formula that is composed of four specific variables, which include a block group’s intersection density, proximity to transit stops, employment mix, and employment & household mix. While these factors are important in determining a block group’s walkability, it leaves out several qualitative and environmental variables that may also influence whether a person chooses to walk. For starters, the index fails to include details about the quality and safety of the surrounding infrastructure, such as whether sidewalks are actually present and if they are damaged/obstructed. It also does not take into account the speed limit for vehicles in the area or whether traffic slowing measures such as speed bumps or stop signs exist. Additionally, crime rates and dark alleyways/walking areas are not part of the walkability index formula, which many people would mark as a top priority for deciding whether to walk. Other aspects of the index that are left out are environmental factors, such as whether the area has steep hills, which can make walks physically demanding, or what the weather patterns in the area are like, since very hot or very cold environments can significantly impact walkability. There are many other factors that are also left out in the walkability index and in the dataset, but these are the most notable.

The original source, which is contained within a CSV file, is based on the EPA’s Smart Location Database, which contains more than ninety different metrics that measure the various aspects of how accessible a location is and how the built environment impacts the location efficiency.
The main organization that funded the creation of the dataset was primarily the Environmental Protection Agency. Using funding from the federal government, EPA developed the Smart Location Database, which is used to measure land efficiency, the National Walkability Index to measure the degree to which an area facilitates walking, The Smart Location Calculator which can measure how efficient a workplace is based on location, and the Access to Jobs and Workers via Transit tool which measures how easily certain areas can be accessed by public transportation.
The way that the dataset’s ontology is structured is mainly in the form of a table consisting of multiple rows in a CSV file. The columns include GPS locations of all the locations in relation to the other columns in the dataset, which allows it to be extremely accessible in terms of creating a geospatial visualization, such as a thematic map. The data showcased also consists mainly of numeric, interval, and ratio data, which requires careful treatment of any quantitative claims being made in relation to the dataset.